Showing posts with label Missouri Covid19 stats. Show all posts
Showing posts with label Missouri Covid19 stats. Show all posts
Thursday, April 13, 2023
Saturday, April 2, 2022
Covid $$$ Income Hospitals - Big Pharma
What will be the total hospital payouts for all the combined Covid cases?
No Wonder Big Pharma pushed this bioweapon on the people.
I'm rechecking these numbers. If this is how much Hospitals earned from Covid I see why the push used to get everyone inoculated with the bioweapon:
— Scotty (@StLHandyMan) April 3, 2022
[All States] Total Per Covid Patient $2,631,471,568.63
Average [State] per Covid Patient $171,431.37 #BigPharma https://t.co/ZhMbo84bnZ
HHS recently began distributing the first $30 billion of emergency funding designated for hospitals in the Coronavirus Aid, Relief, and Economic Security Act. Some of the states hit hardest by the COVID-19 pandemic will receive less funding than states touched relatively lightly, according to an analysis by Kaiser Health News.
 |
| Missouri $175,000 received by the Government for each covid case reported State-by-state breakdown of federal aid per COVID-19 case |
What sort of care did the victims of the bioweapon receive in West Virginia compared to New York? pic.twitter.com/0u1QBh9thm
— Scotty (@StLHandyMan) April 3, 2022
What sort of Car was provided to the different states?
The first round of grants will be distributed based on historical share Medicare revenue, not based on COVID-19 burden. Therefore, hard-hit states like New York will receive far less per COVID-19 case than most other states.
HHS said it doled out the first slice of funding based on Medicare revenue to get support to hospitals as quickly as possible. The agency said the next round of grants "will focus on providers in areas particularly impacted by the COVID-19 outbreak," rural hospitals and other healthcare providers that receive much of their revenues from Medicaid.
Below is a breakdown of how much funding per COVID-19 case each state will receive from the first $30 billion in aid. Kaiser Health News used a state breakdown provided to the House Ways and Means Committee by HHS along with COVID-19 cases tabulated by The New York Times for its analysis.
Missouri $175,000 received by the Government for each covid case reported State-by-state breakdown of federal aid per COVID-19 case https://t.co/KPaU6ZdScr?
— Scotty (@StLHandyMan) April 3, 2022
per COVID-19 case
Alabama
$158,000
Alaska
$306,000
Arizona
$23,000
Arkansas
$285,000
California
$145,000
Colorado
$58,000
Connecticut
$38,000
Delaware
$127,000
District of Columbia
$56,000
Florida
$132,000
Georgia
$73,000
Hawaii
$301,000
Idaho
$100,000
Illinois
$73,000
Indiana
$105,000
Iowa
$235,000
Kansas
$291,000
Kentucky
$297,000
Louisiana
$26,000
Maine
$260,000
Maryland
$120,000
Massachusetts
$44,000
Michigan
$44,000
Minnesota
$380,000
Mississippi
$166,000
Missouri
$175,000
Montana
$315,000
Nebraska
$379,000
Nevada
$98,000
New Hampshire
$201,000
New Jersey
$18,000
New Mexico
$171,000
New York
$12,000
North Carolina
$252,000
North Dakota
$339,000
Ohio
$180,000
Oklahoma
$291,000
Oregon
$220,000
Pennsylvania
$68,000
Rhode Island
$52,000
South Carolina
$186,000
South Dakota
$241,000
Tennessee
$166,000
Texas
$184,000
Utah
$94,000
Vermont
$87,000
Virginia
$201,000
Washington
$58,000
West Virginia
$471,000
Wisconsin
$163,000
Wyoming
$278,000
What will be the total hospital payouts for all the combined Covid cases? This number is going to be huge. No Wonder Big Pharma pushed this bioweapon on the people. Greedy B'stards.
— Scotty (@StLHandyMan) April 3, 2022
Tuesday, December 14, 2021
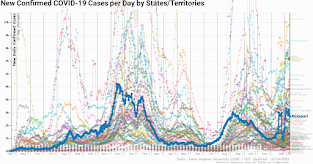
Covid19 Case Graphs with Reports MO
An interactive visualization of the exponential spread of COVID-19 in the MidWestern States, with additional Missouri and St.Louis highlights
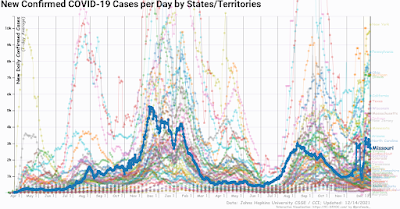 |
| Missouri Highlighted Covid-19 Cases per day |
https://tidbitsbyscotty.blogspot.com/2021/12/covid19-case-graphs-with-reports-mo.html

Detailed Data Report: New Confirmed COVID-19 Cases per Day Midwest States only
Largest percent increases since one week ago:Largest percent decrease since one week ago:- South Dakota: -27.62% change
- North Dakota: -26.74% change
- Minnesota: -17.68% change
- Michigan: -16.55% change
- Nebraska: -15.27% change
Largest percent increases since one week ago:
Largest percent decrease since one week ago:
- South Dakota: -27.62% change
- North Dakota: -26.74% change
- Minnesota: -17.68% change
- Michigan: -16.55% change
- Nebraska: -15.27% change
 |
| Comparing the Total Vaccine vs Deaths for Missouri link |

 |
| Missouri Vaccination Stats vs Deaths for Dec 2020 to Dec 2021 Link |
Detailed Data Report: Total COVID-19 vaccines allocated by States/Territories
This report is generated based entirely on the visualization options you have selected and includes only the data displayed above. As you change the chart options, you can regenerate the report with your new data selection. (Click on any country in this report to add it as an additional highlight.)
Largest percent increases since one week ago:- Missouri: +0% change
Largest raw increases since one week ago:- Missouri: +0 vaccines allocated
Largest percent decrease since one week ago:- Missouri: +0% change
Largest raw decrease since one week ago:- Missouri: +0 vaccines allocated
Try the Interactive Map to Track the Covid-19 Fiasco for your state or Territory. 91-DIVOC
Largest percent increases since one week ago:
- Missouri: +0% change
Largest raw increases since one week ago:
- Missouri: +0 vaccines allocated
Largest percent decrease since one week ago:
- Missouri: +0% change
Largest raw decrease since one week ago:
- Missouri: +0 vaccines allocated
Try the Interactive Map to Track the Covid-19 Fiasco for your state or Territory. 91-DIVOC
Detailed Data Report: New People fully vaccinated from COVID-19 per Day link
This report is generated based entirely on the visualization options you have selected and includes only the data displayed above. As you change the chart options, you can regenerate the report with your new data selection.
Guide to the 91-DIVOC Visualizations
Data Sources
All of the data presented on this visualization comes from a trusted, high-quality data source: either Johns Hopkins University, Oxford University (Our World in Data), or The Atlantic (COVID Tracking Project). You can switch between the data sources by using the "Data Source" control at the top of the visualization. By default, Johns Hopkins University is displayed by default but your data selection can be stored by bookmarking a "Direct Link" that is displayed below each of the visualizations. All data sets are updated multiple times each day.
In the visualization controls, the "Data" selection allows you view various different data about COVID-19, including cases, deaths, tests, hospitalizations, test positivity rates, case fatality rates, and more. If a data selection is not available for a selected source, you will be prompted to switch to a data source where the data is available.
The specific data source used will always be displayed in the lower-right corner of the graph.
Regions
In addition to the country and state data provided by the data sources, several regions are added for additional context. These regions include:
- All World Health Organization (WHO) regions, which includes:
- African Region (WHO-AFRO)
- Region of the Americas (WHO-PAHO)
- South-East Asia Region (WHO-SEARO)
- European Region (WHO-EURO)
- Eastern Mediterranean Region (WHO-EMRO)
- Western Pacific Region (WHO-WPRO)
- The European Union, based off the current union of 27 members states ("EU-27"). Note that the EU-27 does not include the United Kingdom.
- The four United States' US Census Bureau-designated regions:
- Northeast, which includes New Jersey and Pennsylvania and states further to the northeast
- South, which includes Delaware, Maryland, West Virginia, Kentucky, Arkansas, Oklahoma, Texas, and all states south
- Midwest, which includes the Dakotas, Nebraska and Kansas
- West, which includes Hawaii and Alaska
Normalized Data by Population
The first two visualizations displays the raw case data (ex: number of cases, deaths, tests, etc). The last two visualizations displays the same data normalized by the official population displayed in cases per 100,000 people. This normalized view provides a more equatable comparison between regions of different sizes (ex: California, Texas, Illinois, and New York will have more cases if the distribution of cases were uniform simply because they have more residents). The formula used is:
(data value) / (population) * 100,000
The population of each country is sourced from the following Wikipedia pages:- For populations of countries, "List of countries and dependencies by population"
- For populations of US states and territories, "List of states and territories of the United States by population"
Direct Link
Finally, every change you make to the visualization will generate a "Direct Link" that will link to the specific visualization you have created. You can bookmark this link to view it later or share it with friends/family to share the exact graph you are exploring.
More Information
There are many more options to explore in the visualization controls, including the ability to save an image or video/GIF of your graph. This 91-DIVOC project is a side-project of mine while I'm not working on teaching the next generation of students about Computer Science at The University of Illinois. You can read about my motivation for creating this project, and some of the uses it has received, on the "Overview and Motivations " page.
Finally, if you have any questions or feedback, you can write to me (faculty website, and additional contact information at the bottom of this page) -- I read all of the e-mails, reply to as many as I'm able to, and I'd love to hear from you! :)
Subscribe to:
Comments (Atom)
Missouri's Drowned Giants — The Ozark Valleys the Army Corps of Engineers Flooded in the 1930s
Between 1931 and 1979, the Army Corps of Engineers built massive dams across the Ozark region, flooding millions of acres and creating dozen...
.jpg)
-
The psychological phenomenon of "hearing what you want to hear" or confirmation bias , where people selectively attend to informat...
-
.jpg) Why I wrote this I started this series because I believe dandelion has been unfairly demonized as a “weed” while its traditional uses and em...
Why I wrote this I started this series because I believe dandelion has been unfairly demonized as a “weed” while its traditional uses and em... -
added after posting 33 Ways To Get Rid Of Parasites: How To Cleanse Parasites For People and Pets With All Natural Methods by Stephen Tvedte...


