Donations Accepted and Appreciated https://cash.app/$StlScotty

Donations Accepted and Appreciated https://cash.app/$StlScotty
Donate Here To Support Scottys Independent Citizen Journalist Activities https://cash.app/$StlScotty
Copyright Disclaimer under Section 107 of the Copyright Act of 1976, allowance is made for "fair use" for purpose such as criticism, comment, news reporting, teaching, scholarship, and research. Fair use is a use permitted by copyright statute that might otherwise be infringing. Non-profit, educational or personal use tips the balance in favour of fair use.Creative Commons License
This work is licensed under a Creative Commons Attribution-ShareAlike 3.0 Unported License.

Search This Website

Sunday, December 26, 2021

Today Collins Next Fauci

 [NIH Director] Collins is a criminal and has been taken to a processing center from where he will be sent to a military penitentiary to await trial source RRN


JAG investigators then produced printed copies of lengthy email exchanges between Collins and Fauci. In them, the devious doctors plotted to maliciously discredit and malign credible scientists and physicians who questioned the need for lockdowns and mask and vaccine mandates. Their correspondence clearly showed that Collins was a willing participant in the Deep State’s plan to defame critics of its narrative. In one email Collins wrote, “We need to focus on scientists with credibility. We should destroy them, digging into their past and the past of their family and friends, look for anything we can find to impugn them,”

Thursday, December 23, 2021

Remember when George said this

 This material is from more than 20 years ago,listen carefully every single words he said bcs he is honest as F here, also this type of Documentaries are not found anymore on MSM like it was in the 90s,

Tuesday, December 21, 2021

Pedo Wars update

Get your front row seat to the greatest show on earth.

 Satanic pedophiles versus no-step-back kick-ass Patriots for control of the planet. The Pedo Wars saga continues with the last year of Trump’s US presidency and the first year of Biden’s

where the issue of pedophilia is incorporated into a wider geopolitical spectrum. There is more emphasis on the Q plan and the final battle between good and evil takes on global significance.

Tuesday, December 14, 2021

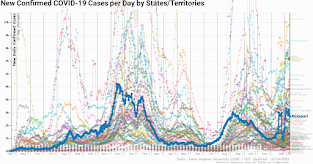
Covid19 Case Graphs with Reports MO

An interactive visualization of the exponential spread of COVID-19 in the MidWestern States, with additional  Missouri and St.Louis highlights
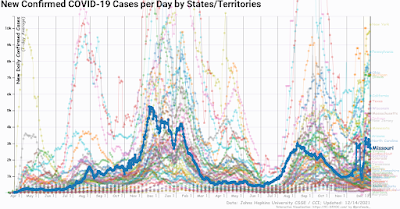

Missouri Highlighted Covid-19 Cases per day 


Missouri Interactive Map of Covid 19 Cases per day
https://tidbitsbyscotty.blogspot.com/2021/12/covid19-case-graphs-with-reports-mo.html


Detailed Data Report: New Confirmed COVID-19 Cases per Day Midwest States only

Largest percent increases since one week ago:
  1. Wisconsin+57.52% change
  2. Illinois+0.1% change
  3. Iowa-0.86% change
  4. Ohio-2.57% change
  5. Indiana-6.03% change
  6. Kansas-8.01% change
  7. Missouri-9.97% change
  8. Nebraska-15.27% change
  9. Michigan-16.55% change
  10. Minnesota-17.68% change
  11. North Dakota-26.74% change
  12. South Dakota-27.62% change
Largest percent decrease since one week ago:
  1. South Dakota-27.62% change
  2. North Dakota-26.74% change
  3. Minnesota-17.68% change
  4. Michigan-16.55% change
  5. Nebraska-15.27% change
  6. Missouri-9.97% change
  7. Kansas-8.01% change
  8. Indiana-6.03% change
  9. Ohio-2.57% change
  10. Iowa-0.86% change
  11. Illinois+0.1% change
  12. Wisconsin+57.52% change
Comparing the Total Vaccine vs Deaths for Missouri link

One Month Saint Louis Missouri Covid Stats

Missouri Vaccination Stats vs Deaths for Dec 2020 to Dec 2021
Missouri Vaccination Stats vs Deaths for Dec 2020 to Dec 2021 Link 


Detailed Data Report: Total COVID-19 vaccines allocated by States/Territories

This report is generated based entirely on the visualization options you have selected and includes only the data displayed above. As you change the chart options, you can regenerate the report with your new data selection. (Click on any country in this report to add it as an additional highlight.)
Largest percent increases since one week ago:
  1. Missouri+0% change
Largest raw increases since one week ago:
  1. Missouri+0 vaccines allocated

Largest percent decrease since one week ago:
  1. Missouri+0% change
Largest raw decrease since one week ago:
  1. Missouri+0 vaccines allocated

Try the Interactive Map to Track the Covid-19 Fiasco for your state or Territory. 91-DIVOC


Detailed Data Report: New People fully vaccinated from COVID-19 per Day link


This report is generated based entirely on the visualization options you have selected and includes only the data displayed above. As you change the chart options, you can regenerate the report with your new data selection. 


Guide to the 91-DIVOC Visualizations

Data Sources

All of the data presented on this visualization comes from a trusted, high-quality data source: either Johns Hopkins University, Oxford University (Our World in Data), or The Atlantic (COVID Tracking Project). You can switch between the data sources by using the "Data Source" control at the top of the visualization. By default, Johns Hopkins University is displayed by default but your data selection can be stored by bookmarking a "Direct Link" that is displayed below each of the visualizations. All data sets are updated multiple times each day.

In the visualization controls, the "Data" selection allows you view various different data about COVID-19, including cases, deaths, tests, hospitalizations, test positivity rates, case fatality rates, and more. If a data selection is not available for a selected source, you will be prompted to switch to a data source where the data is available.

The specific data source used will always be displayed in the lower-right corner of the graph.

Regions

In addition to the country and state data provided by the data sources, several regions are added for additional context. These regions include:

  1. All World Health Organization (WHO) regions, which includes:
    • African Region (WHO-AFRO)
    • Region of the Americas (WHO-PAHO)
    • South-East Asia Region (WHO-SEARO)
    • European Region (WHO-EURO)
    • Eastern Mediterranean Region (WHO-EMRO)
    • Western Pacific Region (WHO-WPRO)
  2. The European Union, based off the current union of 27 members states ("EU-27"). Note that the EU-27 does not include the United Kingdom.
  3. The four United States' US Census Bureau-designated regions:
    • Northeast, which includes New Jersey and Pennsylvania and states further to the northeast
    • South, which includes Delaware, Maryland, West Virginia, Kentucky, Arkansas, Oklahoma, Texas, and all states south
    • Midwest, which includes the Dakotas, Nebraska and Kansas
    • West, which includes Hawaii and Alaska
Each region can be selected as a "Highlight" option in the controls below each graph. Additionally, by choosing "+Add Additional Highlight", multiple selections can be highlighted on each graph.

Normalized Data by Population

The first two visualizations displays the raw case data (ex: number of cases, deaths, tests, etc). The last two visualizations displays the same data normalized by the official population displayed in cases per 100,000 people. This normalized view provides a more equatable comparison between regions of different sizes (ex: California, Texas, Illinois, and New York will have more cases if the distribution of cases were uniform simply because they have more residents). The formula used is:

(data value) / (population) * 100,000
The population of each country is sourced from the following Wikipedia pages:Additionally, the use of data per 100,000 people provides an easy translation to a percentage since 1,000 is 1% of 100,000. Therefore, the thousands-digit comma can be thought of as the decimal point for viewing the data as a percentage of the population. For example, on Oct. 14, 2020, Johns Hopkins' data shows the United States to have a cumulative total of 2,403 confirmed cases / 100,000 people -- or 2.403% of the population of the United States.

Direct Link

Finally, every change you make to the visualization will generate a "Direct Link" that will link to the specific visualization you have created. You can bookmark this link to view it later or share it with friends/family to share the exact graph you are exploring.

More Information

There are many more options to explore in the visualization controls, including the ability to save an image or video/GIF of your graph. This 91-DIVOC project is a side-project of mine while I'm not working on teaching the next generation of students about Computer Science at The University of Illinois. You can read about my motivation for creating this project, and some of the uses it has received, on the "Overview and Motivations " page.

Finally, if you have any questions or feedback, you can write to me (faculty website, and additional contact information at the bottom of this page) -- I read all of the e-mails, reply to as many as I'm able to, and I'd love to hear from you! :)


Thursday, December 9, 2021

Clones, GITMO, Hollywood, Soros, Trump

i've spotted the clones before but i had no idea until i read this set of tweets by our pleiadian brother kab 


Wednesday, December 8, 2021

COVID Truth post12.8.21

Here is the only link anyone on Twitter [Social Media] really needs to see.

1-
Its all bout where the money is going and
2-
how Big Pharma Strong Arming tactics that threatens everybody is working out.


If you can read this and still decide to give yourself over to the pathological pharmaceutical bunch, adios

Monday, December 6, 2021

jab damages immune system ProjectSalus

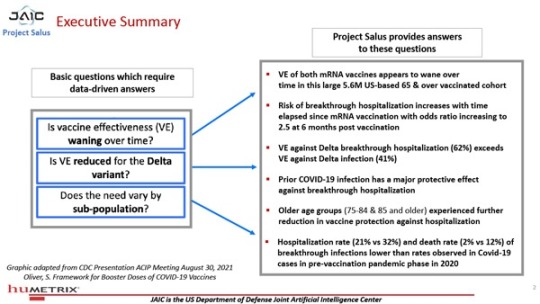
Project Salus data from the DoD / JAIC absolutely shatters the false narrative of Biden, Fauci, Walensky and other “authorities” who are still attempting to gaslight the American people into thinking that hospitals are filled with unvaccinated people. 

 71% of COVID-19 “cases” were breakthrough cases (vaccine failures) once the Delta variant reached 90% spread across those infected

In reality, the vast majority of hospitalizations and deaths are occurring among those who were fully vaccinated, according to the 5.6 million people studied in this particular data set (Medicare).

Project Salus
  • post-vaccine health outcomes are worsening over time
  • meaning that the vaccines appear to be gradually damaging the immune system over subsequent months
  • making vaccinated individuals far more vulnerable to subsequent infections


This is the very definition of ADE (Antibody Dependent Enhancement), about which many analysts such as Dr. Sherri Tenpenny have warned. Now, it appears that ADE is no longer merely a theory but rather a confirmed phenomenon reflected in official Medicare data.

Attorney Thomas Renz told Natural News today that these data should immediately result in not just the FDA’s revocation of mRNA vaccine EUA and approval status, but that the FDA, Fauci and Big Pharma’s top executives should be sued under RICO Act violations for racketeering and organized crime. (He is requesting other attorneys to join in him in helping to accomplish this.)

Project Salus Infographic

Fauci Gain of Function

Saturday, December 4, 2021

Proof Nuremberg Regs Applicable

Part 1 Austria - Pfizer Death Waltz
The original Nuremberg Trials, Punishment, and Rules against using People for experiments against their consent and will continues to be one way to hold people and organizations accountable for their actions, circa 2021.
If Nuremberg regulations, violations, punishment, and other information was not viable in re to Covid.
  
Why would EU chief Ursula von Der Leyen  leader of Austria call for dispensing the Nuremberg Code?

The photo screenshot from tweet below is~ very telling.
Pfizer CEO Alberta Bouria and Ursula von Der Leyen leader of Austria. 

Hand in Hand, cheek to cheek, Pfizer CEO Alberta Bouria and Ursula von Der Leyen leader of Austria, look to be old aquaintences and pals. I wonder if the song they are dancing to is the Death Waltz? 


Links below has Additional 


A future blog post: part 2 titled- World Economic Forum Members and Pfizer connections will be explored. 

Wednesday, December 1, 2021

when the enemy reveals their plans

Team of 1,000 lawyers and 10,000 Medical Experts Start Nuremberg 2 Trial against World Leaders for Crimes Against Humanity - Mark Taliano

Team of 1,000 lawyers and 10,000 Medical Experts Start Nuremberg 2 Trial against World Leaders for Crimes Against Humanity - Mark Taliano

In addition to the flawed tests and fraudulent death certificates, the “experimental” vaccine itself is in violation of Article 32 of the Geneva Convention. Under Article 32 of the 1949 Geneva Convention IV, “mutilation and medical or scientific experiments not necessitated by the medical treatment of a protected person” are prohibited. According to Article 147, conducting biological experiments on protected persons is a grave breach of the Convention.

The “experimental” vaccine is in violation of all 10 of the Nuremberg Codes which carry the death penalty for those who seek to violate these International Laws.

The “vaccine” fails to meet the following five requirements to be considered a vaccine and is by definition a medical “experiment” and trial:


stat counter